Editorial method
Who makes this, how, and why
YoriPrep Editorial focuses each guide on one operating decision a food-service team can use on its next shift.
- Reference material only
- This article is general operating reference material.
- Case scope
- This reference scope is limited to the operating question and illustrative case described in “Menu contribution margin calculator: combine profit per item with popularity”.
- Calculation limits
- The review formula is “First calculate contribution per sale, then multiply by observed units. Popularity provides the second dimension needed for a menu decision.”; it does not determine a store-specific result without current inputs and context.
- Date markers from linked sources
- 3 linked sources state no date. Undated sources are not treated as current; check each link for its present status.
- Professional decisions
- Tax, employment, food-safety, accounting, and legal decisions need current official guidance or advice from an appropriate qualified professional. This article has not received that professional review.
- Publisher
- YoriPrep Editorial at Uberion selects the topic and is responsible for the scope of sources and examples in each article.
- Method
- Public sources are linked directly, and unsourced figures, percentages, and situations are labelled as illustrative. AI may assist drafting or translation, but advertising is limited to source-checked, curated articles.
- Purpose
- We publish to help readers solve one cost, stock, prep, or team-operations problem, not to mass-produce pages for search traffic.
A menu decision needs two dimensions: how much one sale contributes and how often it sells. Define variable-cost scope consistently, then compare contribution and popularity together.
Operator question
“The lowest food-cost percentage should get the most menu space, right?”
The menu, quantities, and figures are illustrative. They explain the method and do not represent a YoriPrep customer or measured outcome.- Review scope
- Four items · one four-week period
- Contribution formulas
- 11 per item; 2,640 total contribution
One dish has a lower food-cost percentage, but another sells more and leaves more cash per order. Which one deserves attention?
Calculate contribution per item, multiply it by units sold, and plot that result beside popularity. Food-cost percentage describes one cost relationship; it cannot show total contribution or demand by itself.
Define variable cost before comparing items
Start with ingredient and recipe cost, then decide whether order packaging, channel charges, transaction fees, and directly attributable labor belong in the comparison. Include a cost only when it can be applied consistently across every item in scope.
Do not mix one item’s full channel and labor cost with another item’s ingredient cost only. Keep fixed overhead outside item contribution unless the analysis clearly changes to an allocated operating-margin view.
A fair item comparison uses one explicit variable-cost scope.
Calculate contribution margin per item
Contribution margin per item equals selling price minus the chosen variable cost. A dish priced at 18 with variable cost of 7 contributes 11 each time it is sold.
The 11 is not final profit. It is the amount available to cover fixed costs and then operating profit within the stated scope. Label the scope beside the number so later comparisons remain intelligible.
Contribution per item = selling price − variable cost.
Multiply by units sold to see total contribution
Total contribution equals per-item contribution multiplied by units sold. If the dish contributing 11 sells 240 units, its total contribution is 2,640 for the period.
A higher-contribution dish can still matter less to the period when it rarely sells. Conversely, a popular item with modest contribution may provide more total support for fixed costs.
Total contribution = per-item contribution × units sold.
Define variable cost before comparing items
Start with ingredient and recipe cost, then decide whether order packaging, channel charges, transaction fees, and directly attributable labor belong in the comparison. Include a cost only when it can be applied consistently across every item in scope.
Do not mix one item’s full channel and labor cost with another item’s ingredient cost only. Keep fixed overhead outside item contribution unless the analysis clearly changes to an allocated operating-margin view.
Calculate contribution margin per item
Contribution margin per item equals selling price minus the chosen variable cost. A dish priced at 18 with variable cost of 7 contributes 11 each time it is sold.
The 11 is not final profit. It is the amount available to cover fixed costs and then operating profit within the stated scope. Label the scope beside the number so later comparisons remain intelligible.
Contribution formulas
Move from one item to the whole period without losing scope
First calculate contribution per sale, then multiply by observed units. Popularity provides the second dimension needed for a menu decision.Shows how much one sale leaves to cover fixed costs and operating profit within the stated scope.
Shows how much the item contributed across the selected period.
Places demand and economic contribution beside each other instead of relying on food-cost percentage alone.
One item across a four-week period
- Selling price
- 18
- Same channel and tax convention
- Ingredients and recipe cost
- 5
- Current usable-yield recipe
- Packaging, channel, direct labor
- 2
- Only costs included consistently
- Units sold
- 240
- Recorded four-week quantity
(18 − 7) × 240 = 2,64011 per item; 2,640 total contributionCompare the item’s 240 units and 11 contribution with the rest of the menu before changing price, recipe, placement, or prep.
Contribution is not final profit and does not allocate every fixed cost. Tax, labor, packaging, and channel treatment must match the restaurant’s stated comparison scope.
Multiply by units sold to see total contribution
Total contribution equals per-item contribution multiplied by units sold. If the dish contributing 11 sells 240 units, its total contribution is 2,640 for the period.
A higher-contribution dish can still matter less to the period when it rarely sells. Conversely, a popular item with modest contribution may provide more total support for fixed costs.
Use popularity and contribution together
Plot items against contribution and units sold or popularity share. The result separates high-popularity/high-contribution anchors from items that need price, recipe, positioning, or operational review.
Treat the matrix as a question generator, not an automatic delete list. A low-volume item may serve a dietary need, complete a set, use shared prep efficiently, or support a strategic daypart.
Illustrative item comparison
Contribution per item and units sold answer different questions; read both before acting.
High contribution and high popularity in this example
High contribution but lower volume
Lower contribution with strong popularity
Review role, recipe, placement, and prep before deciding
Illustrative menu-engineering case · not customer performance
Keep labor, channel, and packaging scope visible
Direct labor can be modeled when the restaurant has a defensible item or batch standard. Shared prep, supervision, and idle time should not be forced into a false per-item precision.
For dine-in, pickup, and delivery, maintain separate packaging and channel assumptions when they differ. Compare like with like, and rerun the period when prices, recipes, portions, fees, or mix change.
Method sources
Why menu engineering needs both contribution and popularity
The public sources support contribution and popularity as related menu-management signals. They do not prescribe a universal threshold or automatic menu decision.Break-even point
U.S. Small Business Administration
The SBA break-even method shows why contribution, rather than selling price alone, is the amount available to cover fixed costs.
View sourceDescribe the principles of menu engineering
BCcampus Open Education
BCcampus describes menu engineering through contribution margin and popularity and explains the familiar four-quadrant interpretation.
View sourceFoundations of Restaurant Management & Culinary Arts: Menu Management
National Restaurant Association Educational Foundation
The National Restaurant Association material connects sales mix, contribution, pricing, and menu design within an ongoing menu-management process.
View source
Keep sales, recipe cost, prep, labor, and comparisons in one operating trail
In the YoriPrep app, record sales, maintain ingredient and recipe costs, review prep and labor, then set goals or compare periods. The operator decides how to interpret and change the menu.
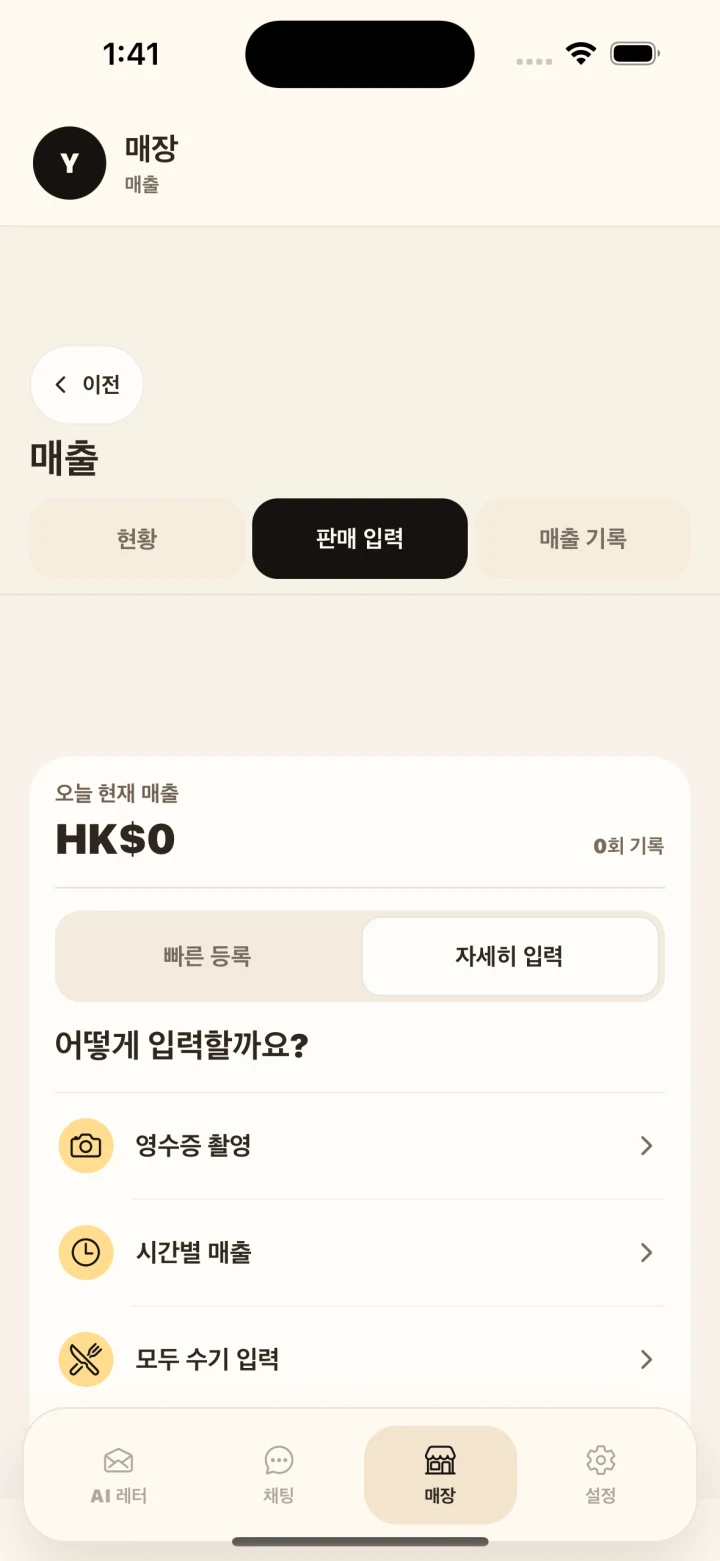
- Record menu sales
Enter item quantities and sales for one consistent period.
- Maintain ingredient and recipe cost
Review usable quantities, portions, and current ingredient costs.
- Review prep and labor
Document the direct work included in the item comparison.
- Set a goal and compare
Compare items or periods and leave the final menu decision with the operator.