Editorial method
Who makes this, how, and why
YoriPrep Editorial focuses each guide on one operating decision a food-service team can use on its next shift.
- Reference material only
- This article is general operating reference material.
- Case scope
- This reference scope is limited to the operating question and illustrative case described in “Restaurant break-even point calculator: units, sales, and the capacity check”.
- Calculation limits
- The review formula is “The unit formula needs a representative contribution per item; the sales formula needs a contribution-margin ratio built from the same cost scope and menu mix.”; it does not determine a store-specific result without current inputs and context.
- Date markers from linked sources
- 3 linked sources state no date. Undated sources are not treated as current; check each link for its present status.
- Professional decisions
- Tax, employment, food-safety, accounting, and legal decisions need current official guidance or advice from an appropriate qualified professional. This article has not received that professional review.
- Publisher
- YoriPrep Editorial at Uberion selects the topic and is responsible for the scope of sources and examples in each article.
- Method
- Public sources are linked directly, and unsourced figures, percentages, and situations are labelled as illustrative. AI may assist drafting or translation, but advertising is limited to source-checked, curated articles.
- Purpose
- We publish to help readers solve one cost, stock, prep, or team-operations problem, not to mass-produce pages for search traffic.
Break-even is a planning threshold, not a sales promise: calculate both units and sales, weight a mixed menu honestly, and reject any target the kitchen or season cannot support.
Operator question
“How many covers do we need before this restaurant pays for the month?”
The restaurant and figures are illustrative. They explain the method and do not represent a YoriPrep customer, forecast, or guaranteed result.- Planning scope
- One month · current menu mix
- Break-even formulas
- 3,000 units or 30,000 in sales
Rent and salaried costs are known, but our dishes contribute different amounts. Should we divide fixed costs by the average selling price?
No. Divide fixed costs by contribution, not price. Calculate a representative per-unit contribution or a weighted contribution-margin ratio, then check whether the resulting volume fits actual capacity and seasonal demand.
Start by separating fixed and variable costs
Fixed costs stay broadly stable within the chosen period: rent, base salaries, insurance, and recurring licenses are common examples. Variable costs move with an order, such as ingredients, order packaging, transaction charges, and direct labor included by the restaurant.
Choose the period first and keep every input in that same period. A monthly fixed-cost total paired with a weekly sales estimate creates a threshold that looks precise but cannot guide a decision.
The denominator is contribution, and every input must share one period and cost scope.
Calculate break-even units from per-unit contribution
Per-unit contribution equals selling price minus the variable cost assigned to that item. If fixed costs are 12,000 and each representative item contributes 4, break-even volume is 3,000 units.
Round the planning volume up and keep the unrounded value in the worksheet. The result says where contribution covers the stated fixed costs; it does not say demand will arrive or every unit can be produced.
Break-even units = fixed costs ÷ per-unit contribution.
Calculate break-even sales from the contribution-margin ratio
The contribution-margin ratio is contribution divided by sales. With fixed costs of 12,000 and a 40% contribution-margin ratio, break-even sales are 30,000.
Use the sales form when the menu contains many prices and a weighted ratio can be built from actual sales mix. Recalculate when pricing, recipe cost, channel share, or product mix changes materially.
Break-even sales = fixed costs ÷ contribution-margin ratio.
Start by separating fixed and variable costs
Fixed costs stay broadly stable within the chosen period: rent, base salaries, insurance, and recurring licenses are common examples. Variable costs move with an order, such as ingredients, order packaging, transaction charges, and direct labor included by the restaurant.
Choose the period first and keep every input in that same period. A monthly fixed-cost total paired with a weekly sales estimate creates a threshold that looks precise but cannot guide a decision.
Calculate break-even units from per-unit contribution
Per-unit contribution equals selling price minus the variable cost assigned to that item. If fixed costs are 12,000 and each representative item contributes 4, break-even volume is 3,000 units.
Round the planning volume up and keep the unrounded value in the worksheet. The result says where contribution covers the stated fixed costs; it does not say demand will arrive or every unit can be produced.
Break-even formulas
Use both the unit threshold and the sales threshold
The unit formula needs a representative contribution per item; the sales formula needs a contribution-margin ratio built from the same cost scope and menu mix.Shows how many representative units must be sold for stated contribution to cover stated fixed costs.
Converts a mixed group of orders into the share of sales available to cover fixed costs.
Shows the sales value required when the weighted contribution relationship is more useful than one unit.
One monthly threshold, checked two ways
- Fixed costs
- 12,000
- Same monthly planning period
- Representative selling price
- 10
- Weighted menu assumption
- Representative variable cost
- 6
- Ingredients and stated order-variable costs
- Contribution-margin ratio
- 40%
- 4 contribution ÷ 10 sales
12,000 ÷ 4 = 3,000 units; 12,000 ÷ 40% = 30,000 sales3,000 units or 30,000 in salesAt 25 open days this implies 120 representative units per day. The operator must now compare that volume with service capacity and seasonal demand.
This illustrative threshold excludes tax and financing treatment unless the restaurant explicitly places them in scope. It is not a demand forecast or performance guarantee.
Calculate break-even sales from the contribution-margin ratio
The contribution-margin ratio is contribution divided by sales. With fixed costs of 12,000 and a 40% contribution-margin ratio, break-even sales are 30,000.
Use the sales form when the menu contains many prices and a weighted ratio can be built from actual sales mix. Recalculate when pricing, recipe cost, channel share, or product mix changes materially.
Treat a mixed menu as a weighted portfolio
A simple average gives a slow seller the same influence as the restaurant’s best seller. Weight each item’s contribution or contribution-margin ratio by its realistic share of sales, and retain the item-level calculation underneath.
Run at least a base mix and a lower-contribution mix. If delivery, discounts, or seasonal items shift volume toward weaker contribution, the restaurant may need more sales than the headline threshold.
Illustrative daily volume check
The same 3,000-unit monthly threshold becomes different operating pressure as open days and capacity change.
Base threshold translated into daily volume
Fewer open days raise required daily throughput
Illustrative station and labor ceiling
Illustrative demand level, not a forecast
Illustrative planning case · replace every input with the restaurant’s own records
Reject thresholds that exceed capacity or ignore seasonality
Translate monthly units into open days, covers per service, prep batches, station throughput, and labor hours. A target above seating, equipment, or prep capacity is not an operating plan even when the formula is correct.
Compare normal, peak, and quiet periods separately. Seasonality, closures, weather, and events can change both achievable volume and staffing, so use break-even as a review trigger rather than a guarantee.
Method sources
Public guidance behind the calculation and its limits
The sources support break-even structure and menu-mix interpretation. The restaurant still supplies current prices, costs, mix, capacity, and operating judgment.Break-even point
U.S. Small Business Administration
The SBA guide presents break-even units as fixed costs divided by selling price minus variable cost, and also explains a sales-based form using contribution margin.
View sourceDescribe the principles of menu engineering
BCcampus Open Education
BCcampus explains menu engineering through contribution margin and popularity, which is why a mixed-menu threshold should reflect actual sales mix.
View sourceFoundations of Restaurant Management & Culinary Arts: Menu Management
National Restaurant Association Educational Foundation
The National Restaurant Association material places contribution and menu performance inside a broader menu-management process rather than treating one percentage as a decision.
View source
Carry the threshold into the records that can change it
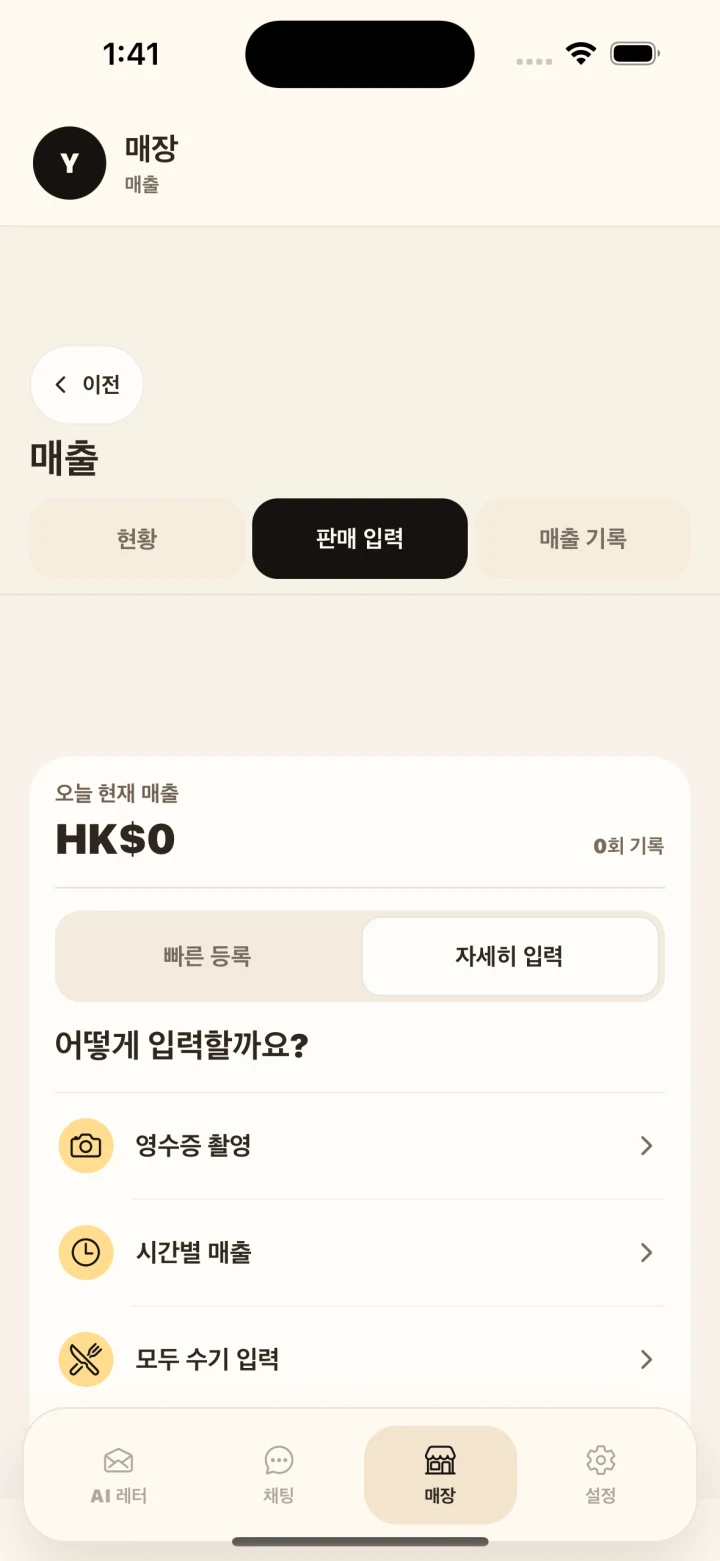
In the YoriPrep app, record sales, ingredient and recipe costs, prep and labor work, then set goals or compare periods. These records let the operator revisit contribution and capacity with the same scope.
- Record sales
Enter sales for the chosen restaurant, menu, and period.
- Maintain ingredient and recipe cost
Use current quantities and costs to keep item contribution reviewable.
- Review prep and labor
Keep included prep work and direct labor consistent with the variable-cost scope.
- Set a goal and compare
Compare actual periods with the threshold and let the operator decide what to revise.