Editorial method
Who makes this, how, and why
YoriPrep Editorial focuses each guide on one operating decision a food-service team can use on its next shift.
- Reference material only
- This article is general operating reference material.
- Case scope
- This reference scope is limited to the operating question and illustrative case described in “Beyond a single score: reading prep performance through five report views”.
- Calculation limits
- The review formula is “These four lines are a reading framework rather than a performance formula. Each comparison assumes the same restaurant, time window, and menu scope.”; it does not determine a store-specific result without current inputs and context.
- Date markers from linked sources
- 4 linked sources state no date. Undated sources are not treated as current; check each link for its present status.
- Professional decisions
- Tax, employment, food-safety, accounting, and legal decisions need current official guidance or advice from an appropriate qualified professional. This article has not received that professional review.
- Publisher
- YoriPrep Editorial at Uberion selects the topic and is responsible for the scope of sources and examples in each article.
- Method
- Public sources are linked directly, and unsourced figures, percentages, and situations are labelled as illustrative. AI may assist drafting or translation, but advertising is limited to source-checked, curated articles.
- Purpose
- We publish to help readers solve one cost, stock, prep, or team-operations problem, not to mass-produce pages for search traffic.
A dashboard is useful when it sharpens the operator’s next question. Compare the same period across cost, margin, sales, and operations, then let the people running the restaurant decide what to change.
Operator case
“The score went up. What, exactly, improved?”
The restaurant, figures, and score below are fictional fixtures designed to explain the reading sequence. They do not represent a customer outcome or measured savings.- Restaurant
- One location with a lunch-heavy sales mix
- Comparison
- Latest four weeks versus prior four weeks
- Decision
- What to verify before changing prep quantities
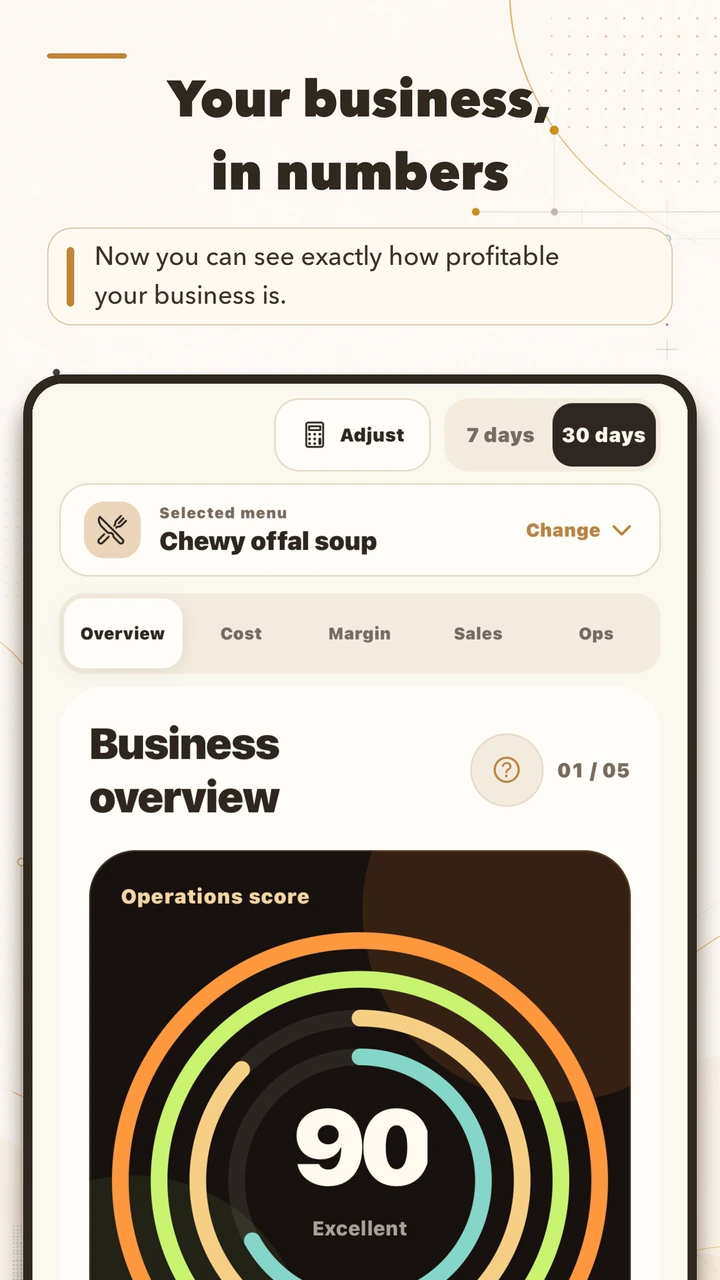
The overview shows a score of 72. Is that enough to say our prep operation improved?
No. The visible 72 is an illustrative preview fixture. Check whether the cost, margin, sales, and operations views tell a consistent story for the same scope, then weigh those signals against what actually happened in the restaurant.
Phase 1 · Turn the overview into questions
Use the overview as a starting point. Confirm the comparison period and identify which movements deserve investigation instead of treating the score itself as the target.
The preview score illustrates the interface; it is not a verdict on customer performance.
Phase 2 · Cross-check the four detail views
Cost shows recorded inputs, margin relates sales to cost, sales shows the recorded demand pattern, and operations shows prep activity. Look for trade-offs that a single summary could conceal.
A comparison is meaningful only when location, period, and menu scope match.
Phase 3 · Add operating context
Promotions, closures, shortages, and menu changes may explain a movement. The operator decides whether to adjust quantities or standards; the report does not execute that decision.
Interpretation and action remain under operator control.
Four signals to examine beside the overview
These are fictional values for demonstrating the chart. The signals have different meanings and should not be ranked as a composite business result.
Illustrative index for recorded cost movement
Illustrative index for the sales-to-cost relationship
Illustrative index for recorded sales movement
Illustrative index for prep activity
Development preview · fictional data
Decision sequence
Keep five views from collapsing into one premature conclusion
These four lines are a reading framework rather than a performance formula. Each comparison assumes the same restaurant, time window, and menu scope.Use the score and highlighted movements to choose a detail view, not to declare success.
Read lower cost alongside sales and margin structure so one favorable movement does not hide a trade-off.
Trace the recorded movement to the menus and periods that contributed to it.
Add promotions, shortages, and closures before deciding whether prep settings should change.
How to read an illustrative score of 72
- Overview score
- 72
- Illustrative interface fixture
- Cost movement
- -3%
- Comparison within the recorded scope
- Sales movement
- +1%
- Observed from entered sales records
- Operating note
- Two weekend promotions
- Context supplied by the operator
Score 72 + cost -3% + sales +1% + two promotions → investigateNo automatic performance verdictThe operator separates the promotion effect, reviews menu-level margin and operations, and only then decides whether a prep adjustment is warranted.
The score and changes are illustrative preview data. They do not guarantee performance, revenue growth, cost savings, or any future result.
Product provenance
What the cited product sources establish
Official product, store, and review-information pages establish product provenance and operating context. They are not independent evidence of customer outcomes.YoriPrep
Uberion
Uberion’s product page identifies YoriPrep and its food-preparation management context. Product provenance only; it is not independent validation of outcomes.
View sourceYoriPrep on the App Store
Apple App Store
The App Store and Google Play listings establish the publisher and public product record, not availability of this development-preview feature. Product provenance only; it is not independent validation of outcomes.
View sourceYoriPrep on Google Play
Google Play
The App Store and Google Play listings establish the publisher and public product record, not availability of this development-preview feature. Product provenance only; it is not independent validation of outcomes.
View sourceYoriPrep App Review information
Uberion
The App Review information page adds review context but does not independently validate dashboard scores or business outcomes. Product provenance only; it is not independent validation of outcomes.
View source
Move from the overview to the evidence behind it
The development preview presents five views: overview, cost, margin, sales, and operations. Operators set the scope, open the relevant detail, and make the final call.
- Align the scope
Confirm that location, period, and menu selection match across views.
- Read all five views
Use overview to choose a question, then cross-check cost, margin, sales, and operations.
- Make an operator decision
Add restaurant context and decide whether any prep setting should change.